انتقل إلى المحتوى الرئيسي

كيفية إنشاء مخطط مع التاريخ والوقت على المحور X في إكسيل؟

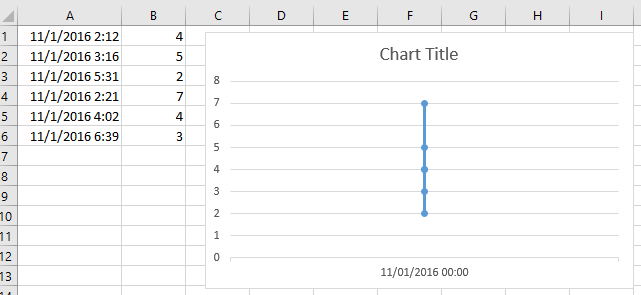
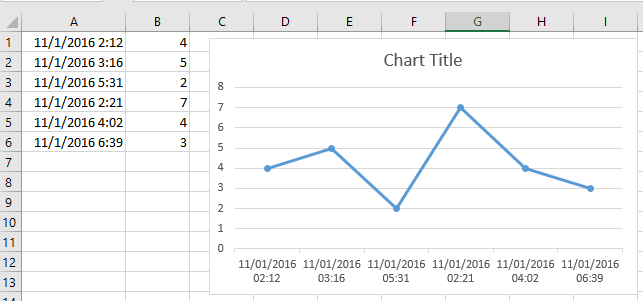
في Excel ، نقوم عادةً بإدراج مخطط لوصف البيانات بشكل أفضل. ولكن في بعض الحالات ، عند إنشاء مخطط عمودي / شريطي / خطي استنادًا إلى سلسلة من التاريخ والوقت ، قد يتم عرض المحور X في المخطط على النحو التالي لقطة الشاشة. وفي هذه المقالة ، أعرض طريقة كيفية إظهار التاريخ والوقت على المحور X بشكل صحيح في المخطط.
مخطط مستند مع تاريخ الوقت 1

قم بإنشاء مخطط بالتاريخ والوقت على المحور X بشكل صحيح


السهم الأزرق الحق فقاعة قم بإنشاء مخطط بالتاريخ والوقت على المحور X بشكل صحيح

لعرض التاريخ والوقت بشكل صحيح ، ما عليك سوى تغيير خيار في ملف تنسيق المحور الحوار.

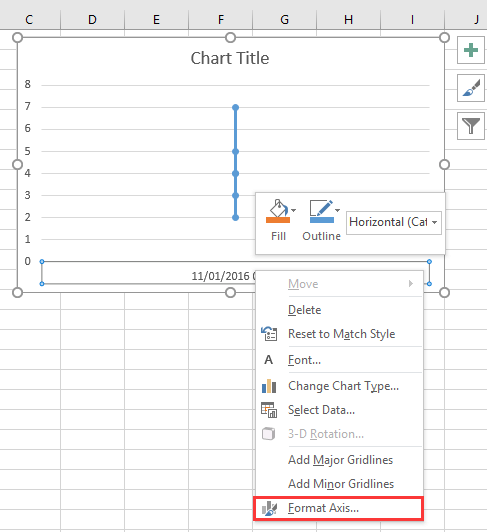
1. انقر بزر الماوس الأيمن على المحور X في المخطط ، ثم حدد تنسيق المحور من قائمة السياق. انظر لقطة الشاشة:
مخطط مستند مع تاريخ الوقت 2

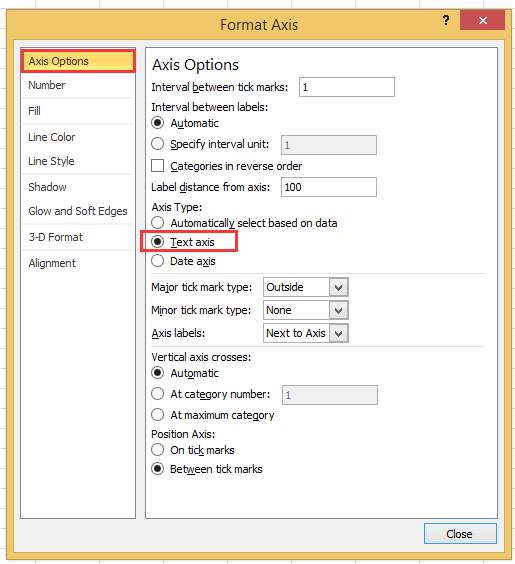
2. ثم في تنسيق المحور جزء أو تنسيق المحور الحوار تحت خيارات المحور علامة التبويب، تحقق محور النص الخيار في نوع المحور الجزء. انظر لقطة الشاشة:
  مخطط مستند مع تاريخ الوقت 4
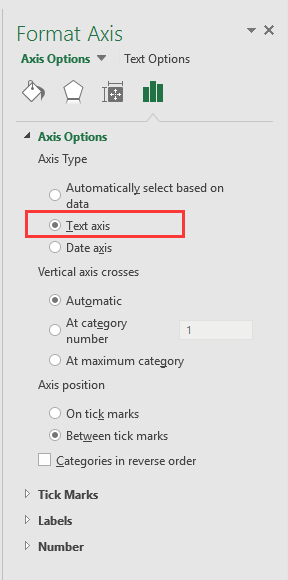
إذا كنت تستخدم إصدار Excel في وقت لاحق من 2010 ، فيمكنك رؤية جزء تنسيق المحور ينبثق ، وتحقق من خيار محور النص ضمن نوع المحور في مجموعة خيارات المحور.
مخطط مستند مع تاريخ الوقت 3

3. انقر اغلاق أو العودة إلى المخطط ، ثم يتم عرض بيانات التاريخ والوقت بشكل صحيح في المحور X. انظر لقطة الشاشة:
مخطط مستند مع تاريخ الوقت 5


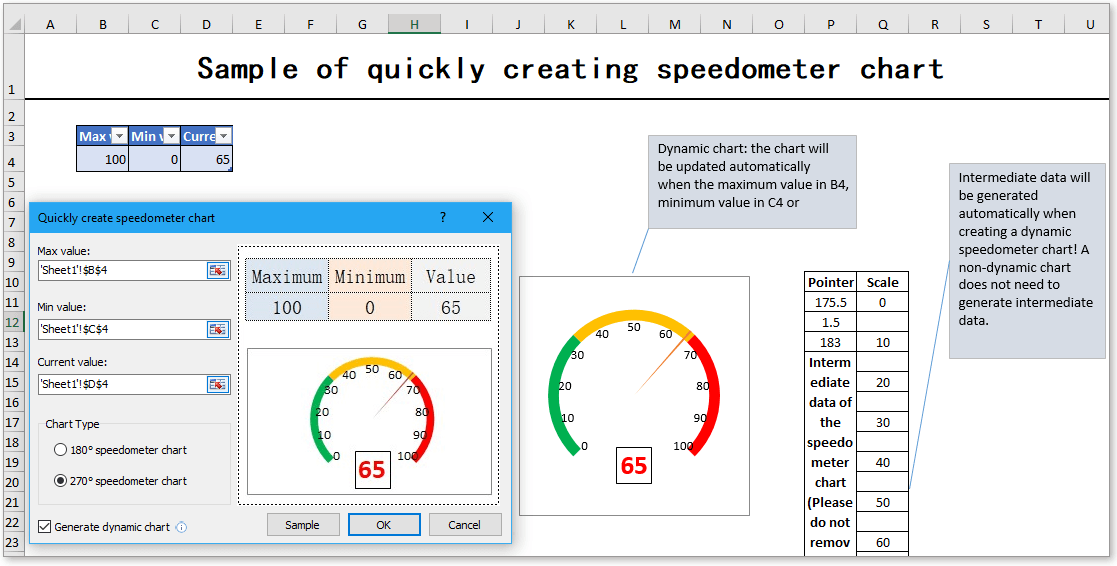
إنشاء مخطط عداد السرعة بخطوتين

في بعض الأحيان ، قد ترغب في استخدام مخطط عداد السرعة لعرض سعر المشروع ، ولكن في Excel ، لإنشاء مخطط عداد السرعة يحتاج إلى العديد من الخطوات المعقدة والمضيعة للوقت. هنا ، مخطط عداد السرعة يمكن أن تساعدك الأداة في Kutools for Excel في إنشاء مخطط عداد سرعة قياسي بخطوتين أبسط. قم بتنزيل هذه الأداة الآن مع نسخة تجريبية مجانية مدتها 30 يومًا.
مخطط عداد السرعة

أفضل أدوات إنتاجية المكتب

🤖 مساعد Kutools AI: إحداث ثورة في تحليل البيانات على أساس: التنفيذ الذكي   |  إنشاء التعليمات البرمجية  |  إنشاء صيغ مخصصة  |  تحليل البيانات وإنشاء الرسوم البيانية  |  استدعاء وظائف Kutools...
الميزات الشعبية: البحث عن التكرارات أو تمييزها أو تحديدها   |  حذف الصفوف الفارغة   |  دمج الأعمدة أو الخلايا دون فقدان البيانات   |   جولة بدون صيغة 
سوبر بحث: معايير متعددة VLookup    VLookup ذات القيمة المتعددة  |   VLookup عبر أوراق متعددة   |   بحث غامض ....
قائمة منسدلة متقدمة: إنشاء القائمة المنسدلة بسرعة   |  القائمة المنسدلة التابعة   |  قائمة منسدلة متعددة التحديد ....
مدير العمود: إضافة عدد محدد من الأعمدة  |  نقل الأعمدة  |  تبديل حالة رؤية الأعمدة المخفية  |  مقارنة النطاقات والأعمدة 
الميزات المميزة: التركيز على الشبكة   |  عرض تصميم   |   شريط الفورمولا الكبير    مدير المصنفات والأوراق   |  مكتبة الموارد (النص السيارات)   |  منتقي التاريخ   |  اجمع أوراق العمل   |  تشفير/فك تشفير الخلايا    إرسال رسائل البريد الإلكتروني عن طريق القائمة   |  سوبر تصفية   |   مرشح خاص (تصفية غامق / مائل / يتوسطه خط ...) ...
أفضل 15 مجموعة أدوات12 نص الأدوات (إضافة نص, إزالة الأحرف، ...)   |   +50 رسم الأنواع (مخطط جانت، ...)   |   40+ عملي الصيغ (احسب العمر على أساس تاريخ الميلاد، ...)   |   19 إدخال الأدوات (أدخل رمز الاستجابة السريعة, إدراج صورة من المسار، ...)   |   12 تحويل الأدوات (أرقام إلى كلمات, نتيجة تحويل عملة، ...)   |   7 دمج وتقسيم الأدوات (الجمع بين الصفوف المتقدمة, تقسيم الخلايا، ...)   |   ... و اكثر

عزز مهاراتك في Excel باستخدام Kutools for Excel، واختبر كفاءة لم يسبق لها مثيل. يقدم Kutools for Excel أكثر من 300 ميزة متقدمة لتعزيز الإنتاجية وتوفير الوقت.  انقر هنا للحصول على الميزة التي تحتاجها أكثر...

الوصف


يجلب Office Tab الواجهة المبوبة إلى Office ، ويجعل عملك أسهل بكثير

  • تمكين التحرير والقراءة المبوبة في Word و Excel و PowerPointوالناشر والوصول و Visio والمشروع.
  • فتح وإنشاء مستندات متعددة في علامات تبويب جديدة من نفس النافذة ، بدلاً من النوافذ الجديدة.
  • يزيد من إنتاجيتك بنسبة 50٪ ، ويقلل مئات النقرات بالماوس كل يوم!
Comments (23)
No ratings yet. Be the first to rate!
This comment was minimized by the moderator on the site
I have the same issue when graphing data that has date AND time: points on the graph are equally spaced, whereas the underlying data has unequal gaps between datapoints. Data is in the form "dd/mm/yyyy hh:mm" formatted as date/time (not text). Data spans multiple days so it's not possible to extract just the time element.
This comment was minimized by the moderator on the site
I have a chart with x-axis in time that stretches during about 6h and 35min. I have data for each 20min in the beginning, then 15min and lastly each 10min. Also, in between I have 45min and 5min data.. The issue that I have, and several others, is that each gap between the date are equally spaced out. Meaning that, even if it is only 5min the gap is the same as if it was 45min.
This comment was minimized by the moderator on the site
i want to make a line graph which contains thousand of entries it's included date, time, month and year, so please help me out.
This comment was minimized by the moderator on the site
Hi, syed Mubashir alam, I do not understand your quetion, if you just create a line graph and the x-axis contains month/day/year hour:minute as below screenshot shown:
https://www.extendoffice.com/images/stories/comments/sun-comment/line-chart-1.png
just follow above steps of the article. If your question is about the axis contents are to long, there is no good idea.
This comment was minimized by the moderator on the site
i want to make a line graph which contains thousands of entries including time, date, month and year but i couldn't make a line graph so please help me out.
This comment was minimized by the moderator on the site
It's good coment that point is not a comma. When you want to add more numericals numbers you should use comma in excel ;)
This comment was minimized by the moderator on the site
Excel menus have changed - this is an out of date article - please update for 2020 .. e.g where is AXIS TYPE now?
This comment was minimized by the moderator on the site
I did not found Excel 2020, just 365 2019, which menus are the same as 2013,2016 version.
This comment was minimized by the moderator on the site
How do I remove days that don't have data in them. Example 8/1-8/31 but not data was captured on 8/3 or 8/4, how do I remove those dates from my graph? They are not in my data table so why is it pulling them?
This comment was minimized by the moderator on the site
Open the Excel file that holds the chart from which you want to exclude dates. Click the X-axis, located underneath the chart, so that it becomes surrounded by a small box. Right-click inside the box and choose "Format Axis" from the popup menu. Click "Axis Options" on the left side of the "Format Axis" window. Locate the three "Axis Type" options in the middle of the screen on the right side of the window. Click the radio button next to "Text axis."
This comment was minimized by the moderator on the site
Hi, I have an issue here. When I opened "Format Axis" and "Axis Options", there is no "Axis Type" choice here
This comment was minimized by the moderator on the site
Hi, Agassi, which Excel version you use?
This comment was minimized by the moderator on the site
Easy, useful, but i didn't know. Thanks a lot
This comment was minimized by the moderator on the site
But it doesnt show them in right relation to eachother. For example 2 hours and 6 hours are same in chart..
This comment was minimized by the moderator on the site
Hi Kiwi, maybe you can paint a chart to show me what you want the chart show.
There are no comments posted here yet
Load More
Please leave your comments in English
Posting as Guest
×
Rate this post:
0   Characters
Suggested Locations